What Makes a Data Set Useful to You?
We can all log into Google Analytics and generate a report that includes lots of data, and most of the time these will appear to be useful. But have you asked yourself whether they actually tell you anything about the health of your website or the behavior of your website's visitors? Here are some examples of data that you might find useful:
1. Website Bounce Rate
Your website's "Bounce Rate" is the percentage of people who visit your website and then leave after viewing only one page, and is immediately available on the main dashboard page when you login:
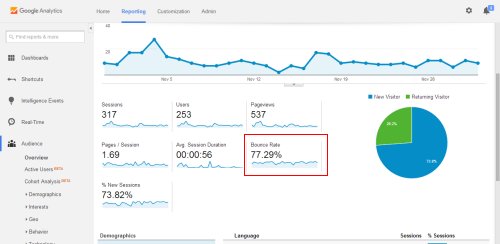
Website visitors who leave after viewing only one page have generally not found what they are looking for - for example it may be that you are ranking highly for some search terms that are not appropriate to your website's overall content and that this is immediately apparent to your website visitors once they land on your website. Or, there might be something about your website that some visitors don't like - for example, your website's design might be outdated or your pages might take a long time to load. However, as a stand-alone number this data actually provides little in the way of useful information - after all, what represents an acceptable bounce rate?
A more useful way to use this data is to compare your bounce rate over the last 30 days with, for example, the previous 30 days or the same period last year by modifying the data range at the top right of the dashboard and checking the "Compare" box. Google Analytics will now return the percentage change between the two date ranges:
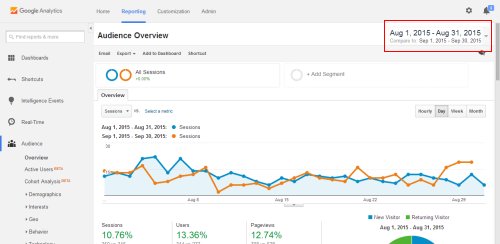
Armed with this information, you now know whether your website is more or less appealing to your website visitors. This can be particularly useful if, for example, you publish a blog or other regularly-updated content. If your bounce rate has increased significantly between the two periods, then perhaps the style or quality of the content you publish needs improving, or if the rate has decreased this could signal that you are publishing the kind of content your audience wants.
2. Search Engine Queries
One of the most useful ways to see how your website is performing in search engines is the "Queries" report, which is available under "Acquisition" header and then the "Search Engine Optimization" sub-header on the left menu. For any date range, you can at-a-glance see the impressions, clicks and average position for your website for search queries on Google that resulted in someone visiting your website.
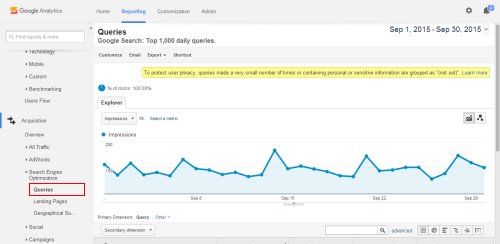
It is worth exploring this report thoroughly to see whether there are search terms you would like to rank highly for but are not, and you can use such information to engage in more effective Search Engine Optimization (SEO). Alternatively, there are some cases where you might accidentally be ranking highly for search terms that are not very relevant to your website. If this is the case, you might want to take advantage of this by offering additional content or services - as long as these still closely match your website's overall theme. And, as with your website's Bounce Rate, this data becomes even more useful when you compare your website's search performance with previous date periods, particularly if you are engaging in any kind of SEO activity.
3. Why Are Your Visitors Not Contacting You?
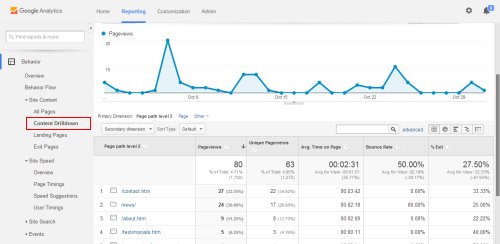
If your website is for a services-related company, the chances are that the main way in which you want your visitors to get in touch with you is via a Contact page. Unlike for ecommerce websites, which sell their products directly to customers in a product-specific way, websites for service-orientated businesses generally have one "Contact Us" page, linked to from all the other pages. If this describes your website, there are two interesting facts you can find out about this page for any given date range. Firstly, you should find out how many of your website's visitors actually visit this page. By navigating to the "Content Drilldown" (under the "Behavior" header and then the "Site Content" sub-header on the left menu),you can see how many times each of your pages has been viewed:
If no or very few visitors to your website actually visit your Contact page, it is important to find out the reason. If most of your inquiries are by telephone and your number is prominently displayed on your website, then this is probably nothing to worry about. But if most of your inquiries are from an inquiry form on your Contact page, you need to address why so few visitors even consider contacting you. The good news is that it is not necessarily because they are not interested in your services - more often than not this can be remedied by having a more prominent Call to Action (CTA).
The second important metric to take note of is whether lots of visitors are in fact visiting your Contact page but are then not actually contacting you. If you own a business with a real-world location that customers can visit, then it may be that your address or map is all they wanted. However, most service-related businesses only have a contact form, and the design and functionality of this form may represent a barrier to your business receiving new inquiries - sometimes just small changes to website forms can have a significant effect on the number of people who complete them.
Conclusion
Hopefully you will be able to see from the examples above that while all of the metrics presented by Google Analytics might be interesting, you have to ask the right questions for this data to become useful. And only if you intend to take some action regarding your findings, and then compare the results over time, will your time be well spent.